In this post, I will first discuss general findings comparing Hispanic eligible voters with the broader population of eligible voters. I will then turn to U.S. Census data to look more closely at Stanislaus county.


Central Valley Hispanics are Unique
As an Anglo with nothing but theoretical knowledge after much reading, I have come to understand that there is no monolithic Hispanic population. For my purposes, if a study on Hispanics doesn’t focus specifically on Central Valley, CA then it is primarily useful as a way to distinguish Central Valley Hispanics from Hispanics in other parts of the country.


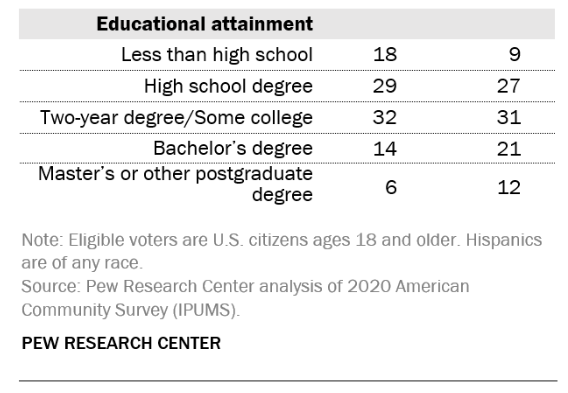
At the national level, eligible Hispanics do not differ from the broader population in Gender. In Age, Hispanics are objectively younger than the broader population. Within individual categories they outnumber the broader population and are outnumbered in, respectively, younger and older citizens. Fewer eligible Hispanics natural born and far more (25/9) are naturalized. Twice as many have less than a high school education, both the broad population and Hispanics have approximately the same percent of high school and two-year college graduates. Far fewer attain a degree beyond a BA.
Finding – At the national level, an eligible Hispanic voter is approximately 38. When compared to the most frequent voting group, older Americans, the broader American population significantly outnumbers Hispanics. In general, compared to the eligible US voting population, Hispanics have with less formal education and more experience with the naturalization process.
With that general overview established, I am now going to turn to the Demographic Statistical Atlas to see how Stanislaus County compares.


Big Finding – Hispanics in Stanislaus do not see themselves as People of Color.


